Table of Contents
Product Growth with Amplitude: A Deep, Practical Guide for Teams Who Want to Move the Needle
If you’re serious about building products people love and proving it with numbers Product Growth with Amplitude is one of the most direct paths you can take. Amplitude has evolved from “a product analytics tool” into a full digital analytics platform that blends product, web, and marketing analytics with experiments, session replay, AI agents, and even warehouse-native analysis. In this guide, we’ll unpack how to use Amplitude end-to-end to drive growth, ship with confidence, and align your organization around customer behavior.
Introduction to Amplitude: What It Is & Why It Matters
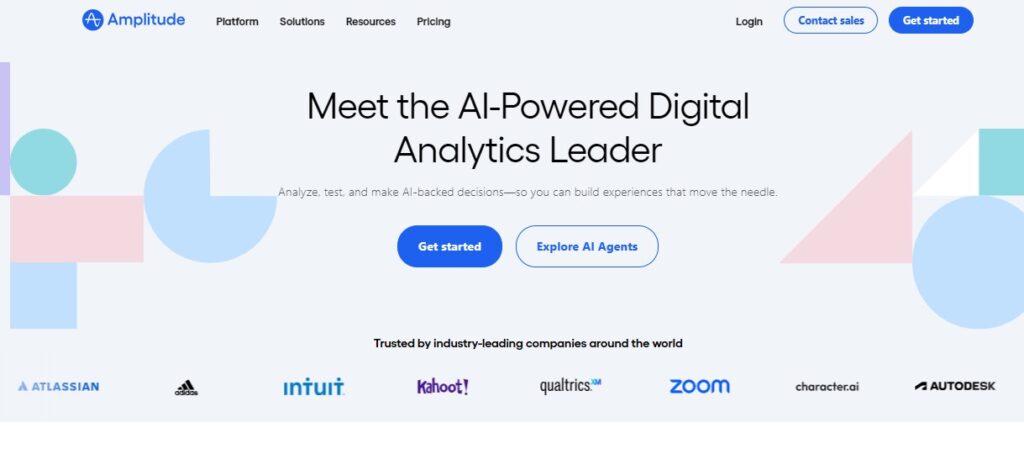
Amplitude is a product and marketing analytics platform that helps teams understand user behavior, measure outcomes, and take action without queuing behind a data team for days. It provides self-serve charts (funnels, retention, paths, cohorts), experimentation, feature management, session replay, and newer AI-assisted workflows so anyone can go from question to answer to action. (Amplitude)
For growth teams, Product Growth with Amplitude means you’re no longer stitching together isolated tools to answer simple questions. You can follow the complete story: how users arrived, what they did, where they struggled, which features led to retention, and which experiments actually moved the metric that matters.
Amplitude’s Core Capabilities: Product, Web & Marketing Analytics
Amplitude’s platform unifies three lenses:
- Product analytics (behavior inside your app or product)
- Web analytics (classic website traffic and engagement)
- Marketing analytics (campaign performance tied to actual product behavior and downstream outcomes)
That “single brain” approach means your team can jump between product usage and acquisition marketing without losing context or switching tools. Amplitude calls this the Digital Analytics Platform and lists Product Analytics, Web Analytics, and Marketing Analytics (Campaign Reporting) as first-class capabilities. (Amplitude)
This unified view is a cornerstone of Product Growth with Amplitude because it aligns acquisition, activation, and retention around the same behavioral truth not just clicks.
How Amplitude Transforms Behavioral Data into Actionable Insights
Amplitude is built on an event-based tracking model. You instrument key user actions (events) with properties (metadata such as plan, device, referral source), and the platform turns these into charts, cohorts, and journey views. From there, behavioral cohorts let you group users by what they did (or didn’t do) rather than static demographics think “completed onboarding in 24 hours” or “invited ≥3 teammates.”
This is the operational core of Product Growth with Amplitude: precise events, rich properties meaningful segments you can analyze, compare, message, or even export to ad platforms and CRMs.
Funnel Analysis & Pathfinding: Identifying Conversion Friction Points
Two workhorse analyses:
- Funnels show step-by-step conversions (e.g., sign-up → onboarding step 1 → step 2 → paywall). You can spot drop-off at each stage, break down by user type or traffic source, and quantify where to focus.
- User paths/journeys visualize the most common routes users take before or after an action, so you can identify detours, loops, and dead ends that eat up activation or monetization.
Teams practicing Product Growth with Amplitude use funnels to size the prize and paths to uncover why drop-offs happen then design experiments or onboarding changes to fix them.
Dashboards, Segmentation & Cross-Project Views for Team Visibility
Amplitude’s dashboards stitch together your key charts into a single view you can share across teams think activation dashboard, weekly growth dashboard, or executive KPI dashboard. You can even include cross-project charts side-by-side (e.g., iOS vs. Android vs. Web), which is essential for platform parity and portfolio-level decisions.
For organizations with multiple products or environments, Portfolio/Cross-project analysis lets you analyze users across multiple projects in one place using Views handy for companies with separate mobile and web apps or multi-brand families. (Note: portfolio/cross-project features live under “Portfolio” and are typically oriented toward higher-tier plans.)
Segmentation is first-class everywhere filter funnels, retention, and paths by campaign, plan tier, country, device, cohort, or any custom property to answer “for whom did this happen?” in seconds. Product Growth with Amplitude becomes real when those segmented dashboards are pinned, shared, and reviewed weekly.
Machine Learning Power: Predictive Cohorts & Forecasting
Amplitude layers ML on top of your behavioral data to surface non-obvious patterns:
- Compass identifies which behaviors predict retention or conversion so you can prioritize features or onboarding steps that actually matter.
- Personas uses clustering to reveal natural user groupings based on actions, not assumptions great for targeting experiments or personalized flows.
These capabilities enable predictive cohorts (e.g., “likely to churn,” “likely to subscribe”) and more reliable roadmaps. It’s the difference between guessing and guiding Product Growth with Amplitude using evidence.
Marketing Analytics and Product Behavior: Unified Attribution Insights
Traditional marketing reporting stops at clicks. Amplitude’s Campaign Reporting and Attribution measures how campaigns influence product behaviors (activation, retention, purchases, feature adoption), not just traffic. The result: a cleaned-up view of “which campaigns bring users who stick and pay,” enabling smarter budget allocation and lifecycle messaging.
This unification is crucial for Product Growth with Amplitude because it closes the loop between paid acquisition and in-product success, letting you optimize for durable value.

Session Replay, Heatmaps & AI Agents: Visualizing User Behavior
Sometimes you need to see what happened. Amplitude’s Session Replay replays real user sessions so teams can observe hesitations, rage clicks, or broken UI flows connected to the same analytics you trust. Web Heatmaps (beta) overlays aggregate interaction intensity helpful for quick UI diagnostics.
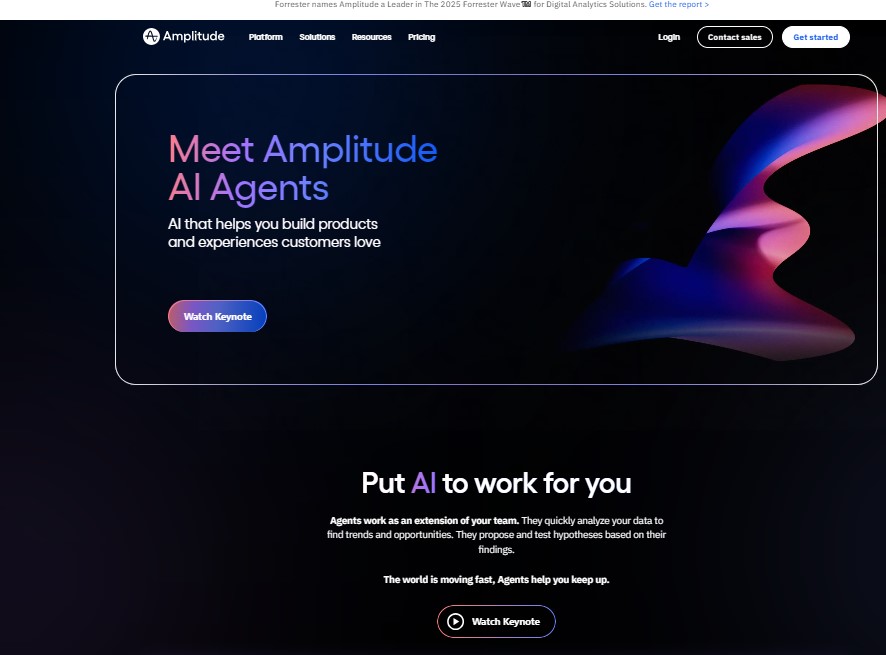
On the guidance side, Guides & Surveys let you nudge users contextually, gather feedback, and measure the downstream impact of these interventions. AI Agents (and the acquisition of Command AI) bring conversational, AI-powered help and guided experiences into your product so users can discover features or accomplish tasks faster, while you capture the behavioral impact.
This end-to-end visibility is why teams lean into Product Growth with Amplitude: you can watch, measure, and improve in one flow.
Experiments and Feature Management: A/B Testing & Deployment Control
Amplitude’s Experiment covers the lifecycle from feature flags to A/B tests to statistical readouts with analysis tied to your core product metrics, not vanity metrics. You can ship behind flags, target rollouts to cohorts, and gate features while you measure lift on retention, activation, or revenue.
For fast-moving teams, this combo makes Product Growth with Amplitude highly actionable: less ceremony, more shipping, and clear answers on whether the change worked.
Data Infrastructure: Warehouse-Native Analytics & Integrations
Amplitude increasingly meets you where your data lives:
- Warehouse-native: Amplitude has a Snowflake Native App, enabling you to run Amplitude inside Snowflake so your data stays put, reducing duplication and governance risk.
- Integrations: A large partner ecosystem and connectors to CDPs, ad platforms, and more keep data in sync both ways for example, sending behavioral cohorts to marketing tools or pulling campaign cost data in.
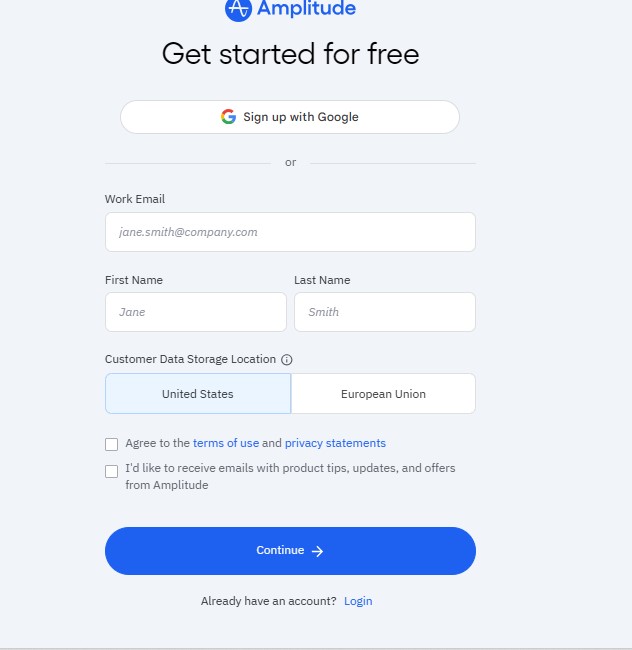
- Governance & security: You choose US or EU data residency at signup, with guidance on how this affects ingestion and storage.
ROI & Business Impact: Real-World Value from Amplitude
A commissioned Forrester Total Economic Impact study found a 217% ROI and a $5.34M revenue impact over three years for a composite organization using Amplitude, alongside time savings for analysts and PMs. While your mileage will vary, it’s a strong external signal that analytics, experimentation, better decisions compound.
Success Stories: Brands Driving Growth with Amplitude
- Rocket Money: Improved experience consistency across platforms, expecting $10M+ in additional annual revenue.
- TicketSwap: Achieved a 15% uplift in sell-flow completion by closing loops between marketing and product and re-engaging cohorts.
- MySwimPro: Increased experiment velocity 10× and boosted ARPU 70% by switching to Amplitude Analytics, Experiment.
Amplitude’s Role in Enterprise Analytics & Digital Transformation
Enterprises need self-serve analytics, data governance, secure residency, and scale. Amplitude’s portfolios, org management, usage reporting, and warehouse-native options allow central teams to set guardrails while enabling product squads to move. Dashboards, portfolio Views, and shared templates promote alignment; Academy programs and certifications accelerate enablement.
Pros and Cons: Weighing Amplitude Against Simplicity and Cost
Pros
- Deep behavioral analytics, experiments, session replay, and campaign reporting in one stack
- Rich segmentation and ML features (Compass, Personas)
- Warehouse-native options and broad integrations for enterprise data strategies.
Cons / Considerations
- Learning curve: The power can feel complex for non-analysts; enablement matters.
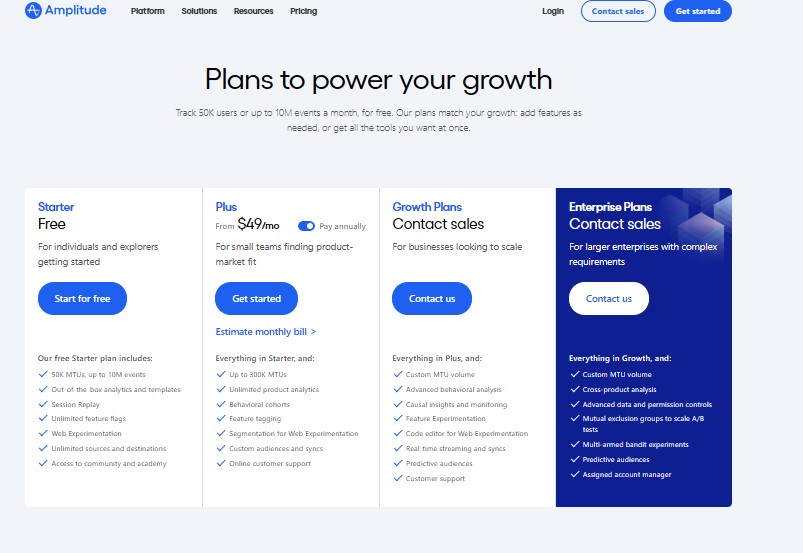
- Pricing: Several reviewers note cost and plan differences (e.g., some cross-project features aligned to higher tiers). Do your homework with sales and forecast event volumes to avoid surprises.
A pragmatic view: start with the free tier, build a realistic event taxonomy, and graduate to paid features as your use cases (and ROI) justify it. That’s a defensible path to Product Growth with Amplitude without overspending.
Amplitude vs. Alternatives: Google Analytics, Mixpanel, Statsig
- Google Analytics 4 (GA4) excels at web marketing analytics and site measurement; it offers events and explorations, but its focus remains acquisition and web engagement. If you need deep product behavior + experiments, Amplitude is purpose-built.
- Mixpanel is a strong product analytics alternative with modern charts. Amplitude differentiates with integrated Experiment, Session Replay, AI Agents/Guides, and warehouse-native options, plus broader marketing analytics (Campaign Reporting). (Evaluate both against your feature needs and scale.)
- Statsig focuses on experimentation and feature gates with powerful statistical tooling. If experiments are your primary need, Statsig is compelling; if you want unified product, marketing analytics, experiments, replay under one roof, Amplitude has the edge.
Bottom line: Teams choosing Product Growth with Amplitude typically want depth across the full loop measure → understand → test → ship → attribute—without juggling four tools.
Recent Innovations: AI Assistants & Personalized User Guidance (e.g., Command AI)
Amplitude has leaned into AI-assisted analytics and in-product assistance:
- AI Agents to guide users contextually
- Guides & Surveys to personalize onboarding and collect feedback
- Acquisition of Command AI, strengthening capabilities for AI-powered user guidance and insights right inside your product experiences.
These help you scale Product Growth with Amplitude beyond analysis toward smarter, adaptive products that teach themselves to be easier.
How to Get Started & Maximize Your Amplitude Investment (Includes Signup & Sign-in)
1) Create your account (free to start).
Visit Get Started and choose your data residency (US or EU). This selection controls where data is stored; you can’t change it later. Then follow the onboarding to instrument your first app with the snippet and optionally enable Autocapture and Session Replay. (Amplitude)
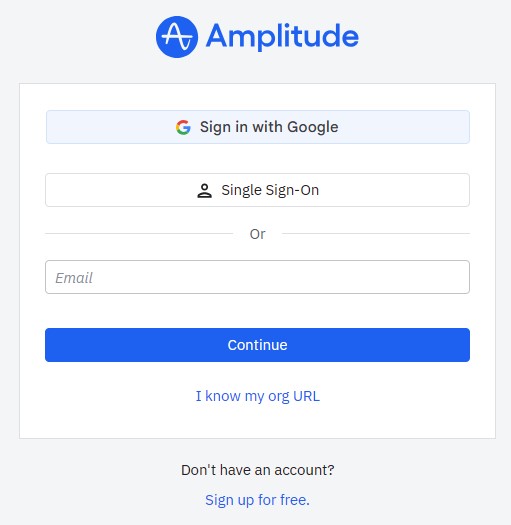
2) Sign in any time.
Use the org login page to access your workspace (SSO supported). Bookmark it for your team.
3) Instrument the right events.
Start with a lean tracking plan: sign-up, activate, invite teammate, key feature use, purchase/upgrade, cancel. Add properties such as plan, acquisition channel (UTM), device, and locale. (Amplitude’s docs and Academy courses walk you through best practices.)
4) Build the foundational dashboards.
- Acquisition → Activation (sign-up to first value)
- Revenue (trial → paid, upgrade rates, churn)
- Experiment quality (win rate, sample ratios, MDE coverage)
Pin them, share them, and review weekly.
5) Tie marketing to product outcomes.
Connect ad platforms and use Campaign Reporting so you can answer: which channels produce retained, paying users? Shift budget accordingly.
6) Close friction with Replay, Heatmaps.
Use Session Replay and Web Heatmaps (beta) to validate hypotheses from funnels/paths and prioritize UX fixes.
7) Test, don’t guess.
Ship features behind flags, target cohorts, and run A/B tests. Measure lift on your north-star metrics and codify learnings.
8) Scale responsibly (enterprise).
Adopt Portfolio for cross-product analysis, leverage warehouse-native options (e.g., Snowflake Native App), and standardize governance with data planning.
Do these consistently and you’ll feel the compounding effect of Product Growth with Amplitude within your first few release cycles.
Conclusion: How to Get Started & Maximize Your Amplitude Investment
To put Product Growth with Amplitude into motion:
- Sign up free and pick your data residency. Instrument the minimal events that reflect your activation, engagement, and monetization loop. (Amplitude)
- Build your first dashboards for acquisition activation, retention, and revenue. Share them widely and review weekly.
- Unify marketing + product with Campaign Reporting, then reallocate spend to channels that create retained, paying customers.
- Triage friction with Funnels, Paths, Replay, and (where available) Heatmaps; fix onboarding and navigation pain.
- Experiment continuously behind feature flags. Codify learnings and scale wins.
- Level up your people with Amplitude Academy and standardize data governance as you scale (including warehouse-native options).
Frequently Asked Questions
Q1: What makes Amplitude different from Google Analytics (GA4)?
GA4 is excellent for web measurement and acquisition reporting; Amplitude focuses more deeply on product behavior and experimentation, tying marketing to downstream in-app outcomes and enabling ML-driven cohorts, session replay, and feature flags all in one place. Many teams run both: GA4 for marketing, Amplitude for product growth.
Q2: How do I set up events and properties without getting overwhelmed?
Start with a short, outcome-based tracking plan: activation steps, core feature usage, and monetization events. Add essential properties (plan, channel, device). Keep naming consistent, use Amplitude’s data planning and Academy resources, and expand only when analyses demand it.
Q3: Can Amplitude handle cross-product or multi-platform analysis?
Yes Portfolio Views let you analyze users across projects (e.g., iOS, Android, Web) and save cross-project charts to the same dashboard. This is especially useful for platform parity and enterprise roll-ups.
Q4: Does Amplitude support experiments and feature flags out of the box?
Yes. You can ship behind feature flags, target rollouts to cohorts, and run A/B tests with clean statistical reads in the same platform where you analyze product behavior.
Q5: How does Amplitude connect marketing to product outcomes?
Use Campaign Reporting and Attribution to map UTMs and ad platform data to in-product metrics like activation, retention, and revenue. You’ll see not just which campaigns drove clicks but which created lasting customers.
Q6: Is Session Replay privacy-safe?
Amplitude provides configuration to mask or exclude sensitive data, and you can choose US or EU data residency at signup to align with compliance needs. Consult your legal team and configure masking appropriately.
Q7: How does pricing work?
Amplitude offers a free tier and paid plans based on event volumes and included features. Review plan details with sales particularly if you need enterprise features like extensive cross-project analysis and project event volumes to avoid surprises.
Q8: Do we need a CDP, or can Amplitude replace it?
Many companies use Amplitude alongside a CDP; others lean on Amplitude’s integrations and warehouse-native options. The right answer depends on your existing stack and whether you centralize identity and routing elsewhere.
Q9: What are some proven results?
Examples include Rocket Money’s expected $10M+ annual revenue lift, TicketSwap’s 15% funnel completion increase, and MySwimPro’s 10× experiment velocity and 70% ARPU improvement.
Q10: Where can my team learn fast?
Start with Amplitude Academy (free courses, learning paths, and badges). Then layer in customer help center docs and Amplitude’s demo environments.


Pingback: Maximizing Marketing ROI with CallRail: A Comprehensive Guide - softdatacore